| Question ID: 1282 | 4/30 | |
| PREVIOUS QUESTION | NEXT QUESTION | |
|
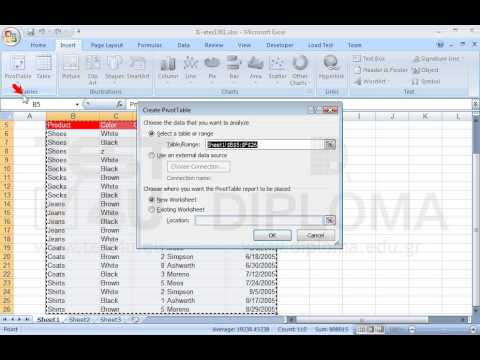
On a new worksheet create a Pivot Table Report based on the data of the cell range B5:F26. Display the Product field in Column Labels, the Salesman field in Row Labels and the Color and Quantity fields in the Values. |
||
| Other versions | ||||||
|


