| Question ID: 603 | 6/16 | |
| PREVIOUS QUESTION | NEXT QUESTION | |
|
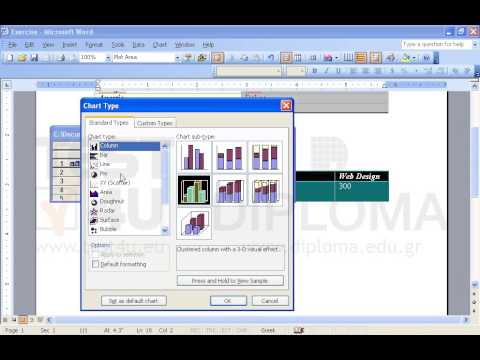
Use the data displayed on the table TEST4U questions count to create an exploded pie chart in 3-D format. (Microsoft Graph Chart) Use black borders, display value data type and a Legend on the top part of the chart. Place the chart just under the table. |
||
| Other versions | |||||
|


