| Fragen ID: 412 | 18/25 | |
| PREVIOUS QUESTION | NEXT QUESTION | |
|
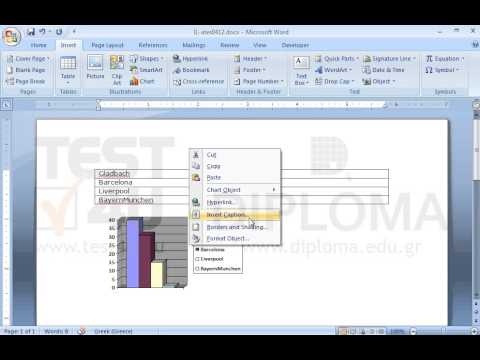
Create a Clustered column with 3D visual effect chart (Microsoft Graph Chart) where all data will be displayed. Insert the following caption Figure 1 Season 1976-1977 under the chart. |
||
| Other versions | |||||
|


