3023

Change the chart type to a 3D clustered Bar chart.

3127

Rotate the contents of the table cells by 90 degrees.

3128

Create a chart similar to the one displayed at the top right photo. Then apply vertical blinds entrance effect advancing on a mouse click at a medium duration (2 seconds). Apply chart grouping by element in Category as in the chart which appears at the bottom-right.

3134

Change the type of the chart which appears on your screen into Line with markers in the MoBe values only. Then apply a color of your choice to the BraP column.

3141

Use a straight connector between the decision shape and the process shape (Buy the application) of the existing flow chart.

3142

Delete the arrow connector between the Decision and the Process shapes. (Buy the application). Then use a straight line to connect them.

3143

Delete the arrow connector between the Decision and the Process shapes (Buy the application).

3179

Create a flowchart to resemble the one of the photo and place it at the lower part of the slide. Use orange and T=dark blue colors.

3217

Adjust the minimum value of the vertical (Value) axis at 50 in the chart which appears on the third slide of the current presentation.

3316

Insert the following data concerning the IRAKLIS team:

Points: 4

Victories: 1

Then change only the Points data series of the chart to Line with Markers.

3317

Change the minimum value of the vertical axis to 2, the maximum to 14 and the major unit to 3.

3318

Change the type of the INCOME data series to Area chart type. Then make sure the values of the vertical axis are displayed in millions. Also, display the respective unit labels.

3319

Make sure you navigate to the 3189.xlsx worksheet stored in the IL-ates\Excel folder of your desktop, if you click the chart during the slide show.

3320

Change the connecting arrow between the objects TEST4U and preparatory into straight connecting line, the arrow begin type to no arrow and the arrow end type to arrow. Then delete the connecting arrow between the objects cert4u and video lessons.

3321

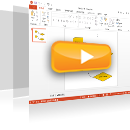
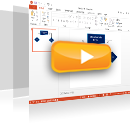
Change the shape of the slide which displays the text Is the school using TEST4U? to Decision shape, without altering the text. Then connect the shapes Is the school using TEST4U? and We stay using an Elbow Connector line with an arrow pointing downwards.

3322

Enter the data

D

344

367

in the chart of the second slide. Then change the chart type to 3-D Clustered Bar with Full pyramid column shape.