| Question ID: 607 | 10/16 | |
| PREVIOUS QUESTION | NEXT QUESTION | |
|
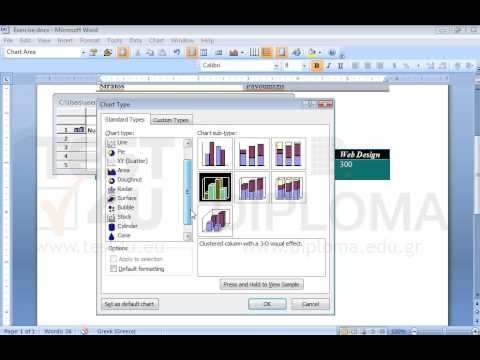
Use the second table data to create a cylinder chart. (Microsoft Graph Chart) Then, insert the text TEST4U questions as title of the chart. Make sure the legend is displayed on the right of the chart. |
||
| Other versions | |||||
|


