One of the most useful measures in statistics is that of standard deviation. It is a measure that is used to quantify the amount of variation or dispersion of a set of data values. I’ll try to explain what this means with an example, but there plenty of other online sources if you want to explore the math behind it.
Practice File:
Transcript
Let’s assume the following population of numbers. These numbers are the exam grades for a student.
The average of this grades is 6.5. And the standard deviation is 1.5. Let’s assume that the student in question has to take one more test tomorrow and we have to guess what its grade will be. It would be safe to say that he would be graded somewhere around his average grade. This is where standard deviation kicks in. It defines approximately how much around the average value we would expect the new value to be. So in our example the expected grade is more probable to be between the range of 5 and 8. 5 is derived from the subtraction of 1.5 from 6.5 and 8 from the addition of the average 6.5 with 1.5 the standard deviation.
When we have only a sample of the data from a population, then the standard deviation we calculate is called sample standard deviation and when the data from the whole population is available then it is called population standard deviation.
Excel has 6 functions to calculate standard deviation. 3 of them calculate the sample standard deviation and 3 the population standard deviation.
Although STDEV and STDEVP functions can still be used in office 2016 for compatibility, they have been replaced by STDEV.S and STDEV.P respectively, and should be avoided, since they might not be supported in future versions of Excel.
STDEV.S calculates the sample standard deviation and STEDV.P the population standard deviation.
STDEVA and STDEVPA also calculate the sample and population standard deviation respectively. Their difference to the previous functions is to the way they treat logical values and text when they are part of our population.
STEDV.S and STEDV.P ignore text and logical values, while STDEVA and STDEVPA count the text as zero and the logical values as 1 and zero for TRUE and False respectively.
Let’s see an example.
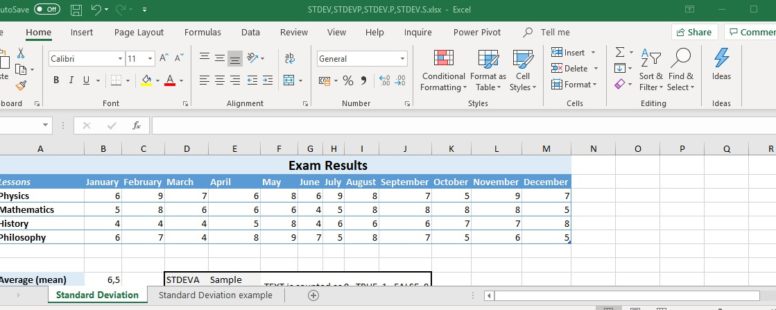
This example has mostly the same data with some minor differences. We have already calculated the mean average as 6.4.
Since this table consists of all of the grades for a certain student we assume this table is our whole population.
So in cell B10 we will calculate the Standard deviation using the STDEV.P and in cell B11 its alternative STDEVPA.
In B10 we type the name of the function and select the data set. The values of SICK and FALSE are ignored during the calculation.
In B11 as before we type the function and the cell range. The value FALSE is calculated now as 0 and the same goes with value SICK. This is the reason for the different result. Otherwise both the functions should produce the same result.
Let’s assume, for the sake of this example, that we only had the exam results for the months from August to December. That means we would have only a sample of the whole population.
So in cells B12 and B13 we will calculate the sample standard deviation using the data for these months.
In B12 we type the name of the function same as before and the cell range, I3 to M6.
We do the same in B13 but using the STDEVA function instead.
Notice the difference between the 2 sets of functions. The ones that calculate the sample and the ones that calculate the population standard deviation.
If this was a real life statistical problem, we should choose to use the functions that consider the absences of the student as zero-graded instead of ignoring them. So we should go with STDEVA and STDEVPA